How to Manage Your CPA Practice Like a Boss Using Power BI Dashboards
By Sarah Krom, CPA, MST, SKC & Co, CPAs, L.L.C., and Ryan Warnet, CPA, MSA, FourZeroNine Solutions, Inc. –
May 30, 2024

Running a CPA firm is challenging, overwhelming, gratifying, frustrating, amazing — we can go on and on. Anyone who says that running a firm isn’t a balancing act that both rewards and tests you either isn’t telling the truth or isn’t giving it their all. So, how do you stack the odds in your favor?
In the last three years, we’ve run our firm with the help of real-time dashboards, prepared by our data analytics company, FourZeroNine Solutions, using Power BI. We use CCH Axcess and leverage Power BI to generate meaningful, clear and user-friendly dashboards. If any company is flush with data, it’s a CPA firm; learning to use that data to reduce risk and make smart decisions is a game changer.
Day-to-Day Operations
It’s important to have a view into the workings of the business. For example, our Partner Dashboard has 13 different pages, including the following:
- Billings: The Billings Dashboard drives strategic decision making by enabling year-over-year comparisons to assess client performance and highlight opportunities for increased billings. It helps manage risks by tracking real-time trends and identifying concentration risks. The dashboard’s flexibility for high-level or detailed analysis with the use of various slicers and filters allows for proactive management to ensure that the firm remains on course. It calculates the average billable rate and compares write ups and write downs across three years.
- AR aging: This may sound like a standard report, but our AR Aging Dashboard allows us to filter by partner to sort amounts. The automated data refreshes, and with ease of accessibility, our partners can check on real-time outstanding payments within seconds.
Staffing Management
A firm’s greatest asset is its team. It’s helpful to use dashboards related to capacity, hours worked and service codes to make the best decisions for your team. For example:
- Staff budget versus actual: This tool is designed to optimize project and staff management. We look to align projected billable hours for each staff member with project budget hours assigned to them and then compare actual hours worked. By analyzing capacity percentages, partners can make informed decisions about shifting workloads or strategically hiring to meet demand. It also helps to enhance overall firm productivity and client service by making sure work is completed on time and no staff member is overworked.
- Client/staff: This dashboard shows all of the clients worked on by the selected staff and illustrates monthly billable hours. We use this report to determine who will be most impacted by a client leaving, what work needs to be reassigned in the event a client leaves and which clients will be impacted if a team member leaves.
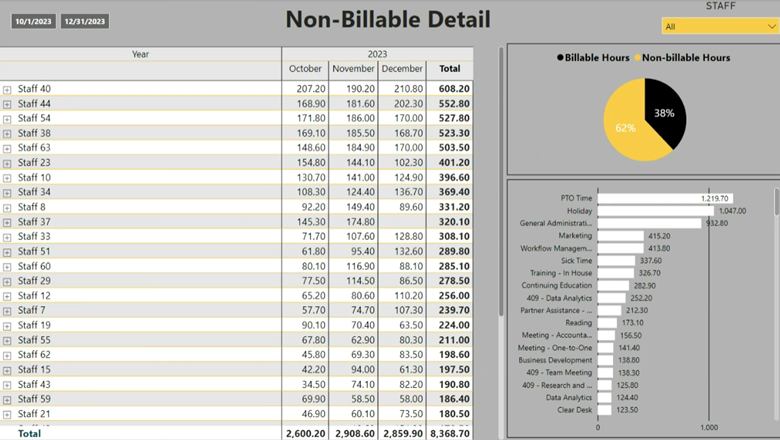
- Non-billable detail: Diving into detail of non-billable time aids in uncovering inefficiencies within workflows, which can free up time for billable work. The ultimate goal of this report is to identify and streamline processes, enhance productivity and increase profitability. By analyzing non-billable time, we gain greater visibility into the day-to-day operations that do not generate revenue.
Long-Term Strategic Decisions
Leveraging data enables firm leaders to influence strategy and stay ahead of the curve in planning, evolving, growing and innovating. Some of the dashboards we use include the following:
- Client groupings: We stratified and grouped our clients by annual billing range (e.g., over $75,---; $55,----$75,---), which allows us to review each revenue grouping by total invoices amount, percent of total invoiced amount, average price for the group, total hours worked on the group and percent of total hours. We use this dashboard to make decisions on raising our fees and rates and to make sure we have the right mix of team members to handle the mix of client sizes.
- Client ranking: We rank our clients in categories A through D based on a set of criteria we developed internally, and the dashboard allows us to review billings and write-ups/downs by ranked category. We can filter by partner and date and expand each ranked category to see which clients are in each. We use this dashboard to analyze potential lost billings if an entire ranking was to be purged and to determine if we are hitting our long-term goals by working exclusively with A- and B-level clients.
- Employee profitability/client profitability: These dashboards show profitability by client or team member with filters by partner and drill downs that allow for all the detail to be reviewed. We can drill into the employees who worked on the client or into the clients worked on by one employee. It provides billable percentage and write ups/downs. We use these dashboards to discover which clients may need to have their fees raised, where there’s scope creep and which team members may need more training. This allows us to analyze why certain people and clients are most profitable.
It's important to have access to this platform across all devices, including phones, and to pull up real-time data at your fingertips whenever needed. This helps save time, eliminate guess work and make better decisions. To see sample screenshots of our dashboards, visit njcpa.org/newjerseycpa.
Dashboard Examples
Dashboard 1: High Level/Firm View
Dashboards 2&3: Cross-Filter Ability
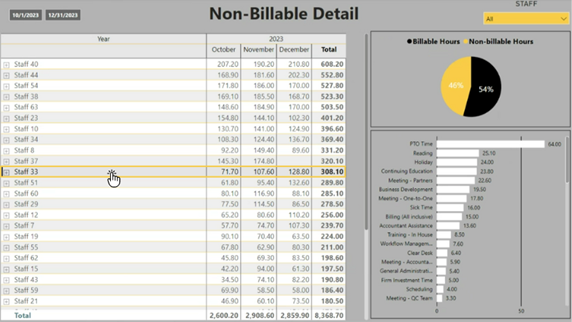
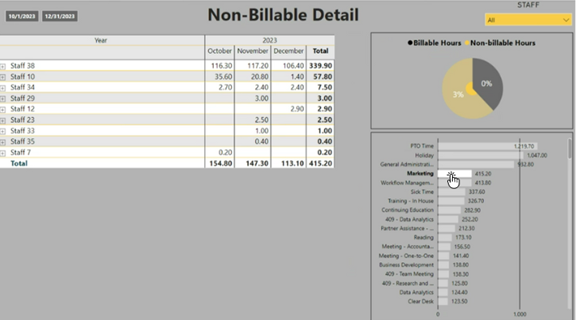
Cross-filtering makes it easy to see details quickly or find more information on any outliers if they exist.
Dashboard 4: Drill-Down Capability
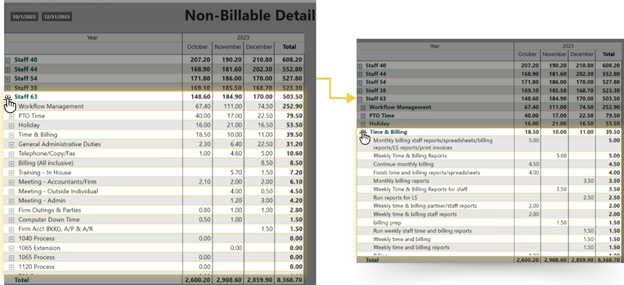
We can analyze time with the tasks that are being completed. Diving into this detail provides insight into how many hours per month are spent on specific tasks. In this example, we can see the amount of time staff 63 is spending on what seems to be reports on Time & Billing. Is this an acceptable amount of time? Is it a concern? Is this something we can automate and free up over 10 hours per month for Staff 63?
What’s Next?
A logical next step is to journey into process automation. At SKC, we developed a list of reports, tasks and actions that were previously manual and repetitive. FourZeroNine is delivering solutions for all of them, saving us time, energy and resources. We automated our quarterly commissions report, weekly team flash report and monthly billings report.
Be on the lookout, across all departments, to automate redundant, time-consuming and manual processes with the help of data analytics. For example, looking ahead, we will be redesigning our marketing dashboard, creating a hiring predictor and automating our proposal and new client set-up processes.
As new challenges come up or areas of a practice become a focal point, it’s important to have the data and the evidence to make the right decisions. The ideas are endless, so having a data analyst team working with you on a regular basis is vital.
 | Ryan P. WarnetRyan Warnet, CPA, MSA, is an accountant and data analyst at SKC and Co. CPAs L.L.C. and president of FourZeroNine Solutions, Inc. He is a member of the NJCPA and is vice leader of the Emerging Technologies Interest Group. |
 | Sarah KromSarah Krom, CPA, is the managing partner at SKC and Co. CPAs L.L.C. and a past president of the NJCPA. She serves on the NJCPA Education Foundation Executive Committee and the Nominating Committee. More content by Sarah Krom: Learn more from Sarah Krom: |
This article appeared in the Summer 2024 issue of New Jersey CPA magazine. Read the full issue.